Section II. Forsyth Futures Analysis: Risk Factors for and Outcomes of Poverty
As part of the Poverty Thought Force’s effort to identify issues and potential policies to address them, Mayor Joines engaged Forsyth Futures to review in-depth selected risk factors for and outcomes of poverty, focusing on Winston-Salem and Forsyth County and comparing with city/county pairs that are demographically similar. That report and conclusions follow. Sources for this section are contained in Appendix D.
Introduction
Persistent poverty can have enduring effects on a community and its residents. Distressed neighborhoods, or areas of concentrated poverty, experience a complex network of disadvantages such as poorer quality of public and private sector services, higher crime and violence, social networks that can undermine wellbeing, and a lack of access to jobs.(1) Empirical evidence suggests that children growing up in low-income neighborhoods are more likely to live in poverty as adults than children who live in wealthier neighborhoods.(2,3)
To significantly reduce poverty in Winston-Salem and Forsyth County, a comprehensive evaluation of poverty within the community is essential. It is also illuminating to contrast this particular community with similar communities across the country.
This study addresses the five topical themes identified by the Poverty Thought Force, along with broad related areas of concern:
- Employment
- Income
- Education
- Health
- Housing
- Homelessness
- Food Insecurity
Methodology
To provide a comprehensive understanding of poverty in Winston-Salem, Forsyth Futures used several primary data sources. Academic literature was used to inform analysis and provide additional information on how the issues studied relate to poverty.
Secondary data sources, such as the U.S. Census Bureau’s American Community Survey, were also analyzed to provide local statistics on poverty. Forsyth Futures staff have analyzed the data to assess its quality and ensure that the differences they report over time, between communities, and between demographic groups reflect actual differences in the population and not sampling errors or chance. This report uses the language of statistical significance to describe these differences that are unlikely to be a result of chance or survey methodology. In graphs comparing Winston-Salem to other populations, bars with white stripes indicate that the data represented is not significantly different from that of Winston-Salem, while solid bars represent data that is significantly different.
Comparison Communities
Forsyth Futures identified city/county pairs demographically similar to Winston-Salem and Forsyth County. We paired county data from all counties with 1-year data samples from the American Community Survey (population of 65,000 or higher) in the continental United States with the data of the largest city in that county with a 1-year data sample. These city/county pairs were then compared to Winston-Salem and Forsyth County based on their population size, population growth, rural/urban character, racial demographics, and age demographics. The five peer communities identified were:
- Greensboro/Guilford County, North Carolina
- Kansas City/Jackson County, Missouri
- Little Rock/Pulaski County, Arkansas
- Roanoke City, Virginia *
- Lafayette/Lafayette Parish, Louisiana
*Roanoke City is an independent city, so the Census Bureau classifies it as both a city and a county.
Poverty
Poverty is a complex social concept that can be understood in a variety of ways. This report uses the U.S. Census Bureau’s Official Poverty Measure to study poverty in Winston-Salem. According to the Official Poverty Measure a family of four would typically be considered poor if their family income was less than $24,000 annually.(4)

Figure 1 shows the poverty rate in Winston-Salem, North Carolina, Forsyth County, and the peer cities.
- In 2015, the poverty rate in Winston-Salem was about 23%.
- Winston-Salem has a significantly higher poverty rate than the United States, North Carolina, Forsyth County, Greensboro, and Kansas City.

Figure 2 shows the percentage of United States, North Carolina, Forsyth County, Winston-Salem, and peer city residents in poverty from 2006 to 2015.
- The poverty rate in Winston-Salem increased between 2009 and 2013, it then decreased between 2013 and 2015.
- In most years since 2006, Winston-Salem had a higher rate of poverty than the United States, North Carolina, and Forsyth County. Winston-Salem did not have a significantly higher poverty rate than its peer cities until 2012.
- 2015 was the first year since 2012 in which Winston-Salem did not have a significantly higher poverty rate than the majority of its peer communities.
*Data for these cities have a high level of variance and should be interpreted with caution.
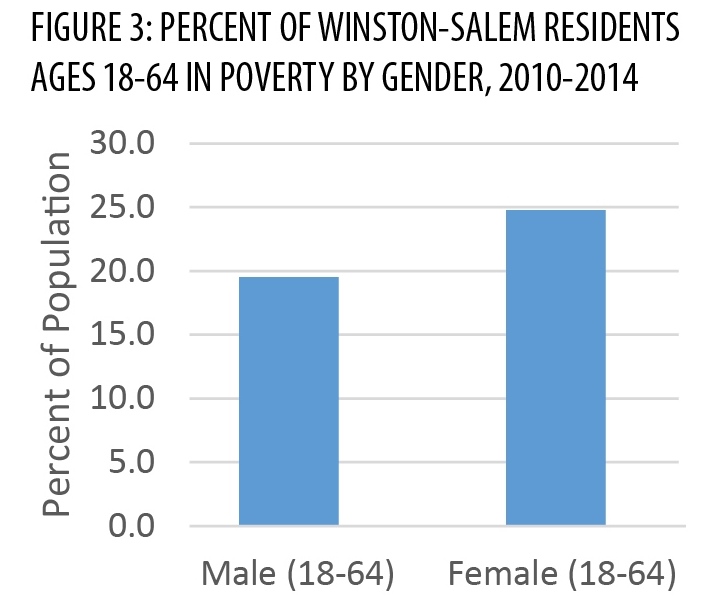
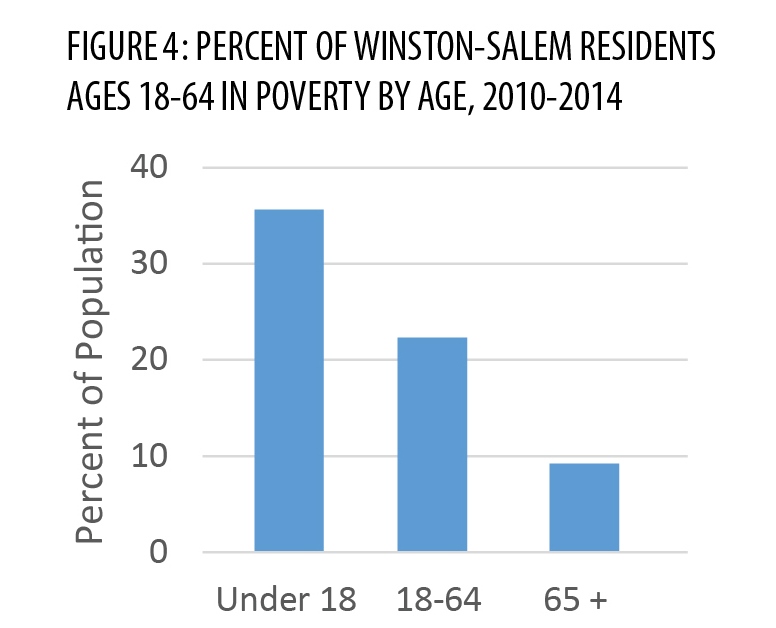
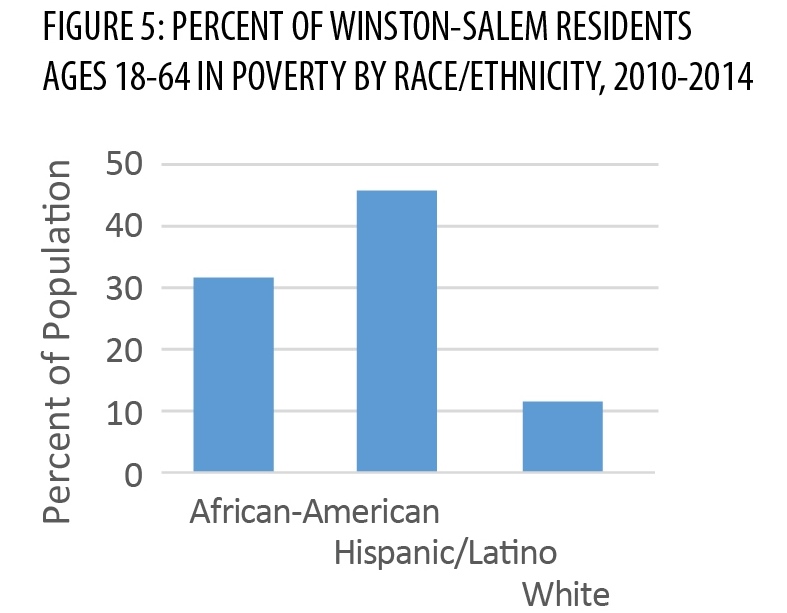
Figures 3, 4, and 5 (below) show poverty rates for different demographics of Winston-Salem’s population.
- Poverty in Winston-Salem disproportionately affects women, children, and people of color.
- An estimated 25% of women in Winston-Salem are in poverty, compared to about 20% of men.
- About one out of every three children in Winston-Salem lives in poverty.
- African-American residents in Winston-Salem are almost three times as likely, and Hispanic and Latino residents are about four times as likely, to be in poverty as White, Non- Hispanic residents.
Employment
Assessing details of unemployment can help a community better understand poverty because high rates of unemployment are often linked to high rates of poverty.(5-8)

Figure 6 shows the unemployment rate in Winston-Salem from 2006 to 2015
- In 2015 the unemployment rate decreased significantly to 8% from 12% in 2014.
- The unemployment rate in Winston-Salem increased sharply after 2007 peaking at almost 14% in 2011.
- Despite some fluctuations, the unemployment rate has decreased since 2012.

Figure 7 compares the unemployment rate in Winston-Salem with the United States, North Carolina, and peer cities.
- In 2015 the unemployment rate in Winston-Salem was significantly higher than the United States and the majority of the peer cities.

Figure 8 shows the relationship between poverty and employment status.
- In 2015 the poverty rate of unemployed residents in Winston-Salem was approximately 42%.
- Residents employed full-time year-round had the lowest rates of poverty.
- Some 23% of residents working part-time or part of the year were in poverty.
* This data has a high level of variance and should be interpreted with caution. Some data points were excluded due to very high levels of variance.

Figure 9 looks at employed residents who also live below the poverty level in Winston-Salem.
- Despite some fluctuation, the poverty rate for full time employees has stayed relatively stable between 2006 and 2015.
- The poverty rate for part time workers in Winston-Salem increased from 2008 to 2013, but has decreased since 2013.
Income

Household income is directly associated with poverty. The Census Bureau uses household income and composition to determine poverty status.(4) Changes in a community’s income do not always happen uniformly for high and low income earners. For example, incomes could rise for households at one end of the distribution and stay the same or drop for households at the other end of the distribution. Even when other major predictors of poverty, like unemployment, experience favorable changes, the rate of poverty in a community might not decrease if household income does not, especially for households making the least amount of money. (7)
Table 1 shows the distribution of income in Winston-Salem; Figure 10 shows this distribution alongside those of other communities; and Figure 11 shows incomes in this distribution from 2006 to 2014.

- In Winston-Salem all families of five members or less who meet the census definition of poverty have incomes in the 20th and 40th percentiles1.
- When compared to the two peer cities with lower poverty rates, Winston-Salem’s 20th percentile household income was not significantly different from that of Greensboro, but it was lower than that of Kansas City. The 40th percentile was lower than that of both cities, which. ????
- Incomes for residents in the 20th percentile fluctuated with a peak in 2008 and a valley in 2012, but the 20th percentile in 2015 was not significantly different from in 2006. However, household income in the 40th percentile, the other percentile in which families in poverty are likely to fall, has generally decreased since 2006.

Figures 12 and 13 show median household incomes for Winston-Salem residents by race and family type.
- Winston-Salem has significant racial disparities in income with Asian-American households making almost twice as much as those headed by African-American and Hispanic/Latino householders.
- The median income for families with children is about $20,000 a year less than that of families without children, which could contribute to Winston-Salem’s poverty rate for children being higher than that of adults.
Education
Educational attainment is an important factor in addressing poverty because having at least an associate’s degree can significantly increase the economic success of an individual.(6,7)
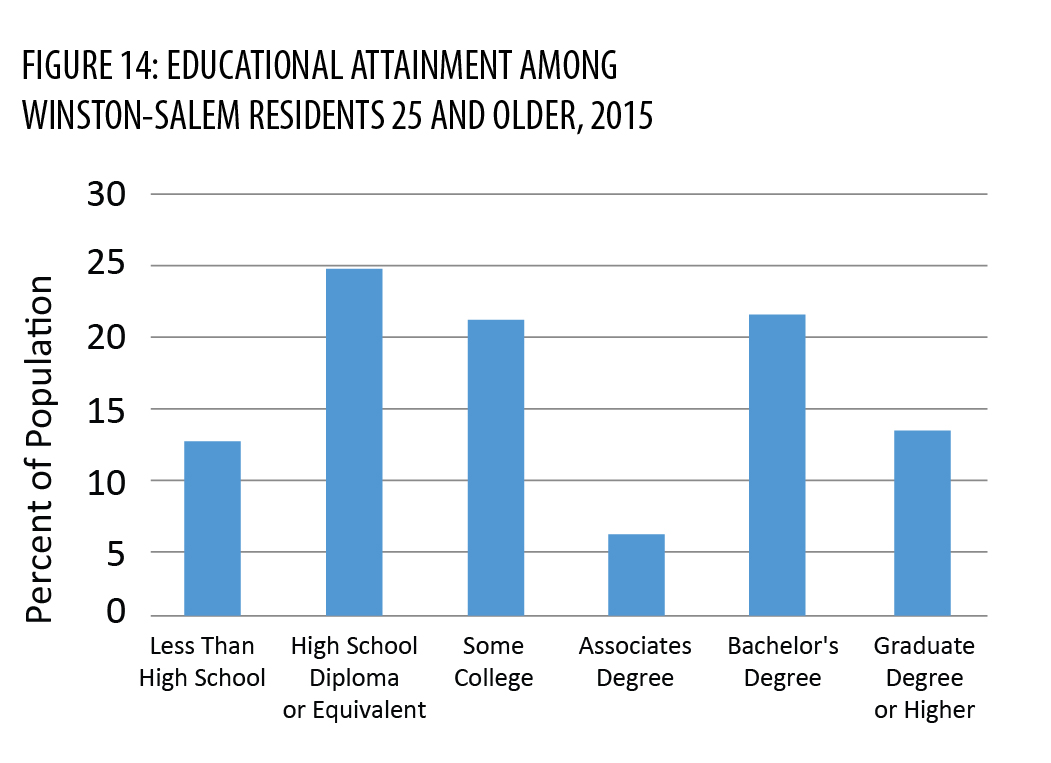
Figure 14 demonstrates that the majority of residents in Winston-Salem, 25 and older, have a high school diploma (or equivalent) or higher.
- In 2015, almost one fourth of Winston-Salem residents 25 and older have a high school diploma or equivalent as their highest level of education.
- Approximately 40 percent of the same group of residents have an Associate’s Degree or higher as their highest level of education.
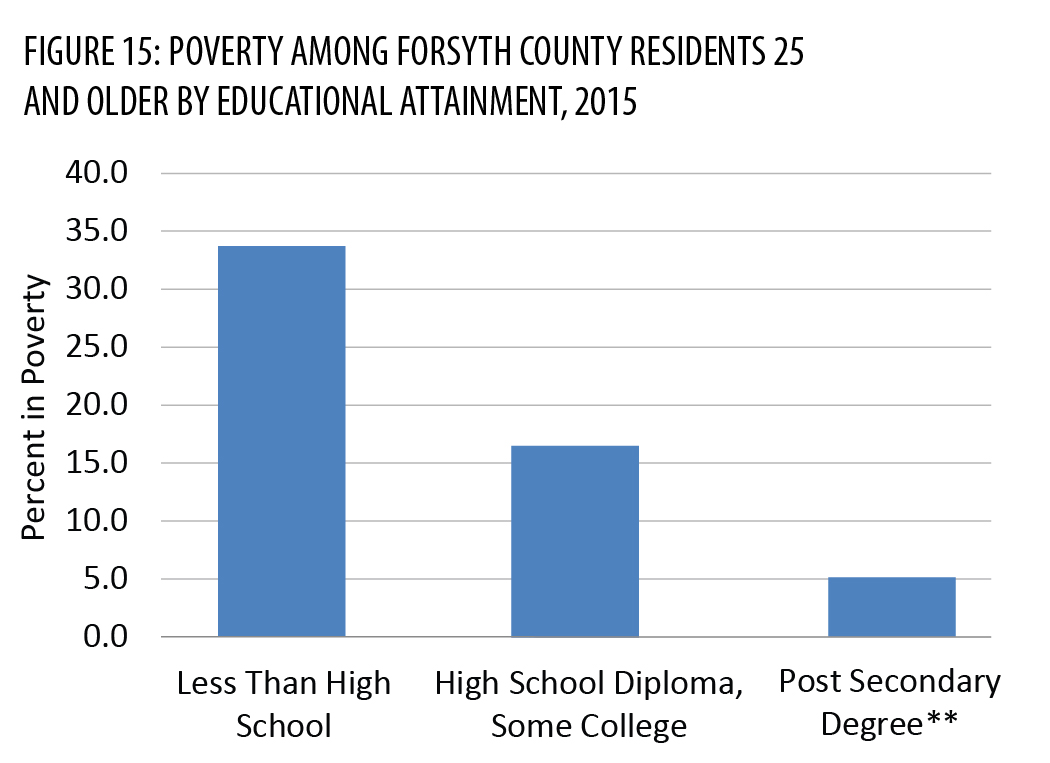
Figure 15 examines the connection between educational attainment and poverty levels in Forsyth County.*
- Forsyth County residents without an associate’s degree or higher are statistically significantly more likely to live below the poverty level than residents with a higher education degree.
*Educational attainment and poverty data is not available for Winston-Salem.
**This estimate has a high level of variance and may not be suited for all purposes.

Figure 16 compares the levels of educational attainment in Winston-Salem by race and ethnicity.
- A higher percentage of White, non-Hispanic residents have post-secondary degrees than any other group.
- Hispanic and Latino residents were about 4 times as likely as other groups to have less than a high school degree as their highest level of education.

Figure 17 compares the poverty rate of Forsyth County* residents ages 25 and over by race and highest level of education.
- White, non-Hispanic residents have lower rates of poverty than minority residents across all three levels of education, suggesting that education is not the only factor contributing to racial disparities in poverty.
- The poverty rates for minority residents with a high school degree are higher than that of White, non-Hispanic residents with less than a high school degree.
Health
Overall health and wellness has been linked to socioeconomic status. (8,11,14-19) There are a number of potential reasons for the connection between health and socioeconomic status. For example, people in poverty may live in neighborhoods without easy access to health care facilities for treatment or preventative care.
Understanding health disparities between socioeconomic groups can illuminate the relationship between health and wealth. This understanding helps create clear, targeted policies in favor of those experiencing hardships related to health.11
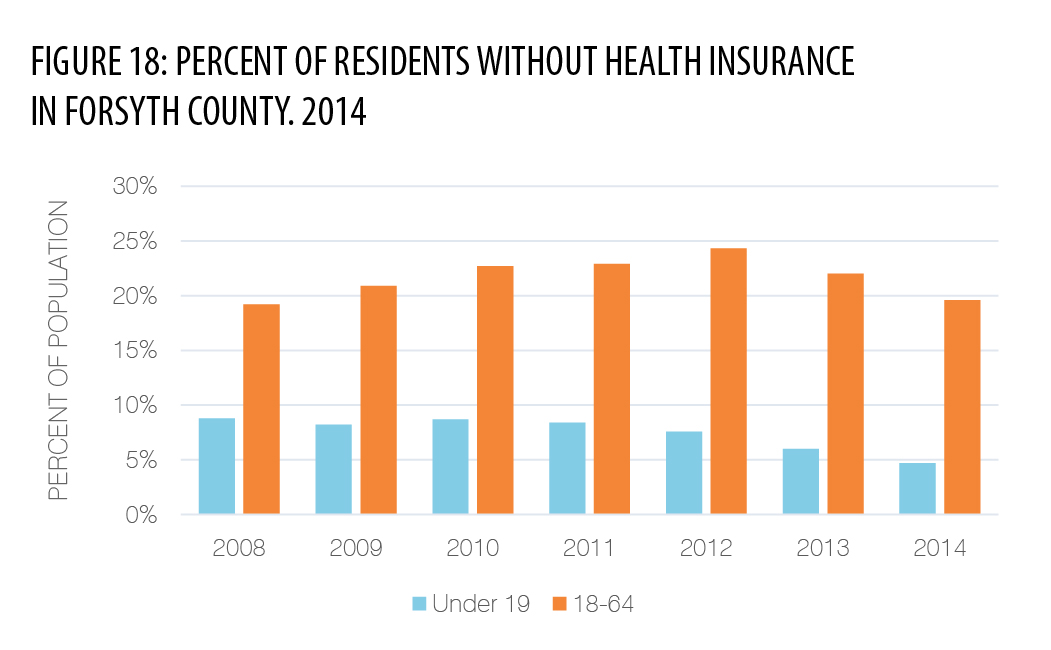
Figure 18 shows a timeline of percentages of people who do not have health insurance.
- In 2014, approximately 15% of Forsyth County residents under the age 65 did not have any form of health insurance.
- In 2014, about 20% of residents 18 to 64 years old and 9% of those under 19 in Forsyth County were uninsured.

Figure 19 shows the percentage of uninsured residents by county and income level.
- In 2014, approximately 27% of Forsyth County residents living below 138% of the poverty threshold were uninsured.
- In 2014, 16% of those between 138% and 400% below the poverty threshold did not have insurance.
Behavioral health refers to a state of mental or emotional wellbeing and/or choices and actions that affect wellness;(12) it is a state in which every individual realizes his or her own potential, can cope with the normal stresses of life, can work productively and fruitfully, and is able to make a contribution to her or his community.(13) If left unchecked, poor mental health can hinder one from living a relatively normal life.
According to a 2013 survey by the Behavioral Risk Factor Surveillance System, 63.6% of Forsyth County residents reported having good mental health.
Physical health encompasses many aspects of wellness from having an active lifestyle to the kinds of foods a community has access to. The relationship between health and poverty status is cyclical in nature; those in poverty are more likely to experience ill health from problems such as inadequate nutrition or inability to afford preventative health care. This intertwined relationship is a "vicious cycle: poverty breeds ill health, ill-health maintains poverty.”(15) Tackling the problems of poverty can help lessen health disparities among community members.16 Having a better understanding of the relationship between health and poverty can change the way a community serves its impoverished residents through allocation of funding for resources or implementation of new public policy.
Housing
This report looks at the impact of housing on poverty in two ways. The first is homeownership. Sustainable homeownership can allow a person to build assets needed to increase financial sustainability.(19) Lack of affordable housing can negatively impact the poverty rate. Homeowners and renters who experience a housing burden are at risk of foreclosure or eviction and increased financial instability and hardship.

Figure 20 compares the homeownership rate in Winston-Salem with the United States, North Carolina, and peer cities across the country.
- The homeownership rate for Winston-Salem in 2015 was significantly lower than the United States, North Carolina, and Forsyth County as a whole.

Figure 21 looks at the difference between renters and owners by race and ethnicity in Winston-Salem.
- In 2015 there was a significant difference in home ownership between residents who are White, non-Hispanic, and African American residents and Hispanic/Latino residents.
- It is twice as likely that a resident who is White, non-Hispanic will own his or her own home versus a resident who is African-American.

Figure 22 compares housing burden of renters and owners between Winston-Salem, the United States, North Carolina, and peer cities.
- In 2015 approximately 20% of homeowners and 47% of renters experienced a cost burden in Winston-Salem.
- In 2015 the percentage of housing burdened, owner occupied units was significantly less in Winston-Salem than the United States as a whole and Roanoke.
Homelessness
The federal government defines homelessness as “individuals and families who live in a place not meant for human habitation (including on the streets or in their car), emergency shelter, transitional housing, and hotels paid for by a government or charitable organization.”(20) Numbers in this report are based on the annual Point in Time Count which occurs one night in January each year to count the number of homeless residents in shelters and on the streets.
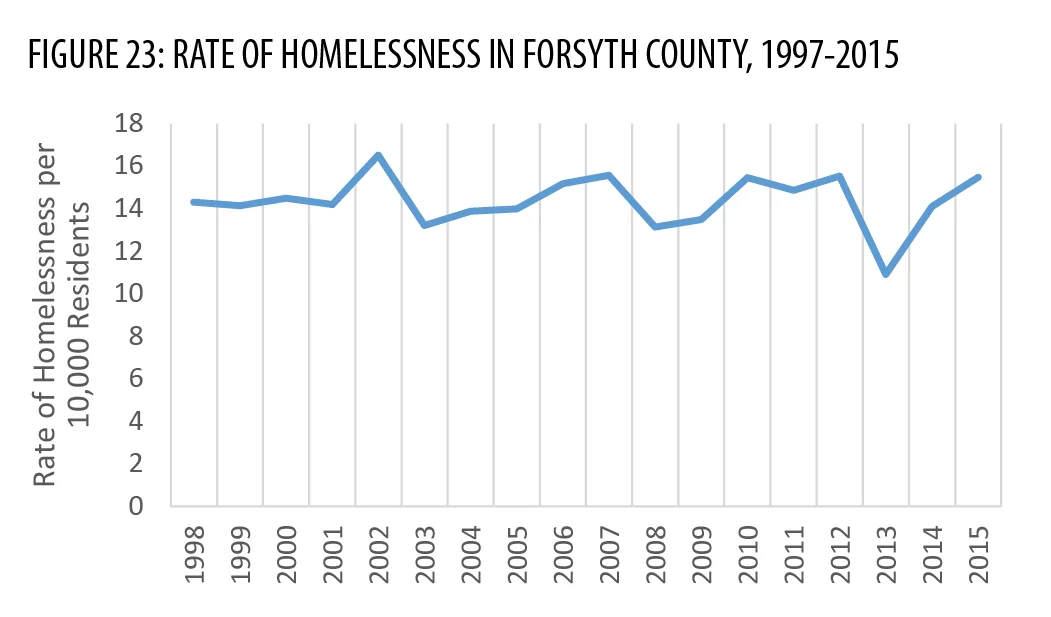
Figure 23 shows the rate of homelessness in Forsyth County as the number of homeless people during the Point in Time count per 10,000 residents from 1997 to 2015.
- In 2015, 571 people were homeless, which means that 15 out of every 10,000 Forsyth County residents were homeless that night.
- While there has been some fluctuation over time, there is not a statistically significant trend in the rate of homelessness from 1997 to 2015.
- The rate of homelessness in Forsyth County in 2015 was statistically higher than that of 2003, 2008, 2009, and 2013 but not statistically different from any other years.

Figure 24 shows the rate of homelessness for Forsyth County residents by veteran status.
- Veterans are nationally at a higher risk of homelessness,(18,19) and in 2015 veterans in Forsyth County were about 50% more likely to be homeless than non-veteran adults.
Figure 25 shows the rate of homelessness by gender.
- Men and boys are about 70% more likely than women and girls to be homeless in Forsyth County.
Figures 26 and 27 show the rate of homelessness by ethnicity and race.
- Non-Hispanic/Latino are more than five times as likely as Hispanic/Latino residents to be homeless.
- African-American residents were almost four times as likely as white residents to be homeless.

Figure 28 shows the rates of homelessness for children and adults from 2008 to 2015.
- In 2015, there were 94 homeless children and 477 homeless adults during the January count.
- In 2015, children were significantly less likely to be homeless than adults.
- Child homelessness increased from 2008 to 2010, and then decreased from 2010 to 2014 before increasing in 2015.
- Adult homelessness in 2013 was significantly lower than other years, but that was the only year with a statistically different rate of adult homelessness.
Food Insecurity
Defined as a household-level economic and social condition of limited or uncertain access to adequate food, food insecurity affects millions of people nationwide.(20) Lack of adequate nutrition affects physical and mental development.(21) Food insecurity is closely related to poverty in that many neighborhoods experiencing hunger and low access to food are also those with low incomes.(22)
Forsyth County residents have different options in accessing food. There are also government assistance programs designed to meet the needs of lower-income residents such as the Supplemental Nutrition Assistance Program (SNAP); Women, Infants, and Children (WIC); and The Emergency Food Assistance Program (TEFAP).
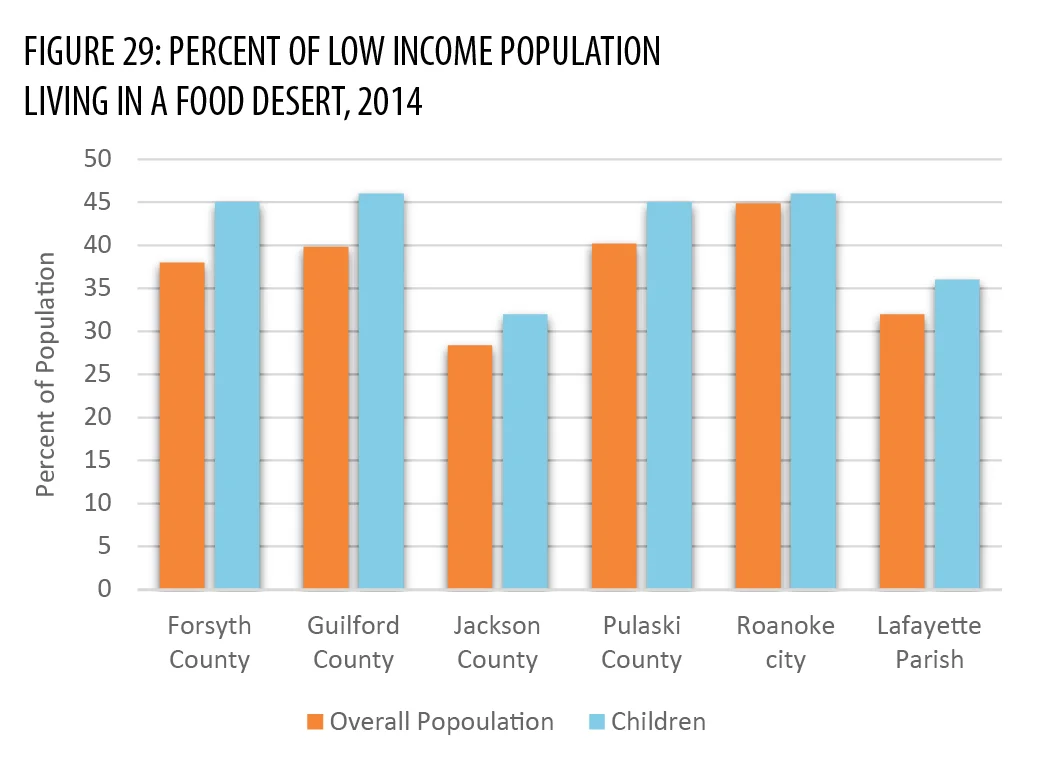
Figure 29 shows the percent of the total population in each comparison community that lives within a neighborhood food desert.
- In Forsyth County, 38% of its low income population lived in a food desert from 2010 through 2014.
- From 2010 through 2014, 45% of low income children were living in a food desert.
Estimated rates of food insecurity calculated by Feeding America are one way of getting an idea of the rate of food insecurity in counties and neighborhoods. Feeding America incorporates a variety of indicators when estimating food insecurity rates including unemployment rate, homeownership rate, and other potential predictors of food insecurity. (23)
Figure 30 shows the locations of Feeding America’s estimates of food insecurity rates in Forsyth County by census tract and food deserts.
- Overall, an estimated 17% of Forsyth County residents experienced food insecurity at some point in 2014.
- To be designated as a food desert, a census tract must be low income. 24 However, not all high poverty census tracts are food deserts.
- Some areas with high estimated levels of food insecurity have multiple food assistance resources, while other areas, such as the neighborhoods south of 40 and east of 52, do not have as many.
Conclusions
Forsyth Futures has concluded that the following are among the risk factors and outcomes of poverty experienced by residents of Winston-Salem and Forsyth County. Research indicates significant disparities in local exposure to these risk factors and outcomes and that local residents are experiencing these risk factors and outcomes at rates similar to or greater than the peer city/county pairs identified by the study.
1. The poverty rate in Winston-Salem is higher than that of some comparable cities, and poverty and many of its risk factors and outcomes disproportionately affect women, children, and minorities.
2. Winston-Salem also has higher unemployment rates than the majority of its peer cities.
3. The incomes of the bottom 20%-40% (the second quintile) of households in Winston-Salem are lower than both of the peer cities with lower poverty rates, which could be contributing to the city’s higher poverty rates. The median household income for households headed by African-Americans and Hispanic and Latino residents are significantly lower than those headed by White residents, which could be contributing to higher poverty rates for those groups. Similarly the median income for families with children is significantly lower than households without children, which could be contributing to high child poverty rates in Forsyth County.
4. Forsyth County residents with at least an associate’s degree have lower rates of poverty than those with lower levels of education, but there are significant racial disparities in educational attainment in Winston-Salem. However, these racial disparities cannot be completely explained by education as racial disparities in poverty outcomes persist across education levels, and the poverty rates for minority residents with a high school degree are higher than that of White, non-Hispanic residents with less than a high school degree.
5. Approximately 15% of Forsyth County residents under age 65 did not have any health insurance in 2014, which could limit their access to health care and put them at financial risk in the event of serious illness.
6. Homeownership can be an important way of building financial assets, but there are significant racial disparities in homeownership. And, a higher percentage of renters experience housing cost burden than homeowners.
7. Despite some fluctuation over time, there has not been any statistically significant trend in the rate of homelessness from 1997 to 2015. Homelessness disproportionately impacts men, non-Hispanic/Latino residents, African-American residents, and veterans.
8. About 38% of poor Forsyth County residents live in a food desert neighborhood, and an estimated 17% of Forsyth County residents experienced food insecurity at some point in 2014.